Market Intelligence Suite
Displacement Labs provides chart visualization software only. The tools do not tell users when to buy, sell, short, hold, enter, exit, or allocate capital. Users remain fully responsible for interpretation, execution, and risk management.
Included Tools
Open Interest Dashboard
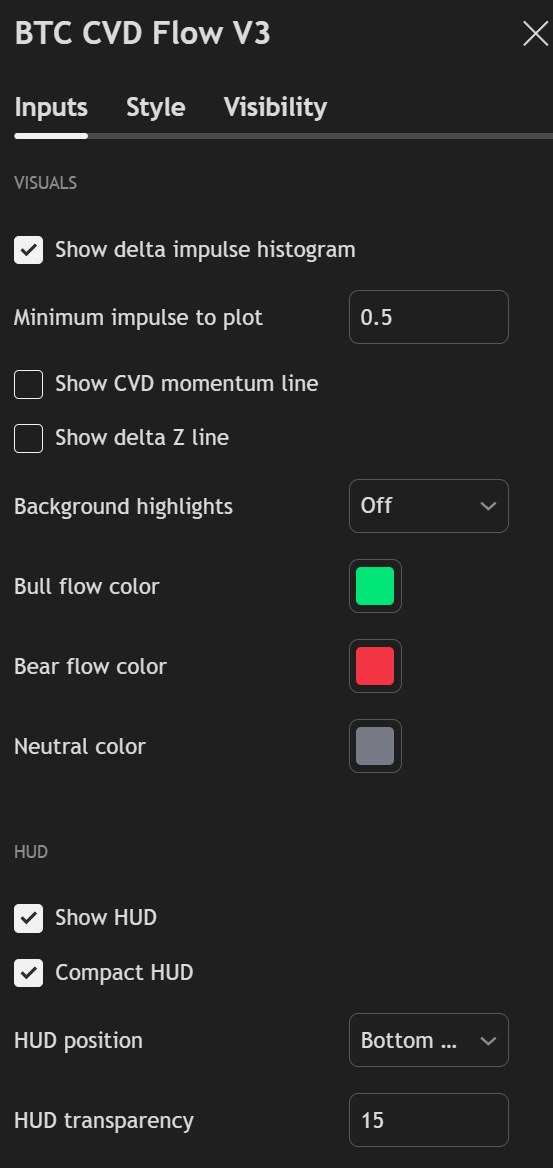
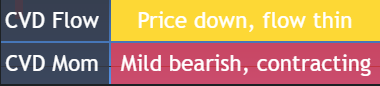
CVD / Flow Tools
Macro State Overlay
Displacement Tools
Liquidation Zone Tools
TP/SL Visualization
Market-structure dashboards and overlays for reviewing digital asset market conditions.
The Market Intelligence Suite organizes digital asset market context into a cleaner charting workflow. It brings together macro state, open interest, CVD/flow, displacement detection, liquidation-zone mapping, and TP/SL visualization so users can evaluate conditions without relying on any single input.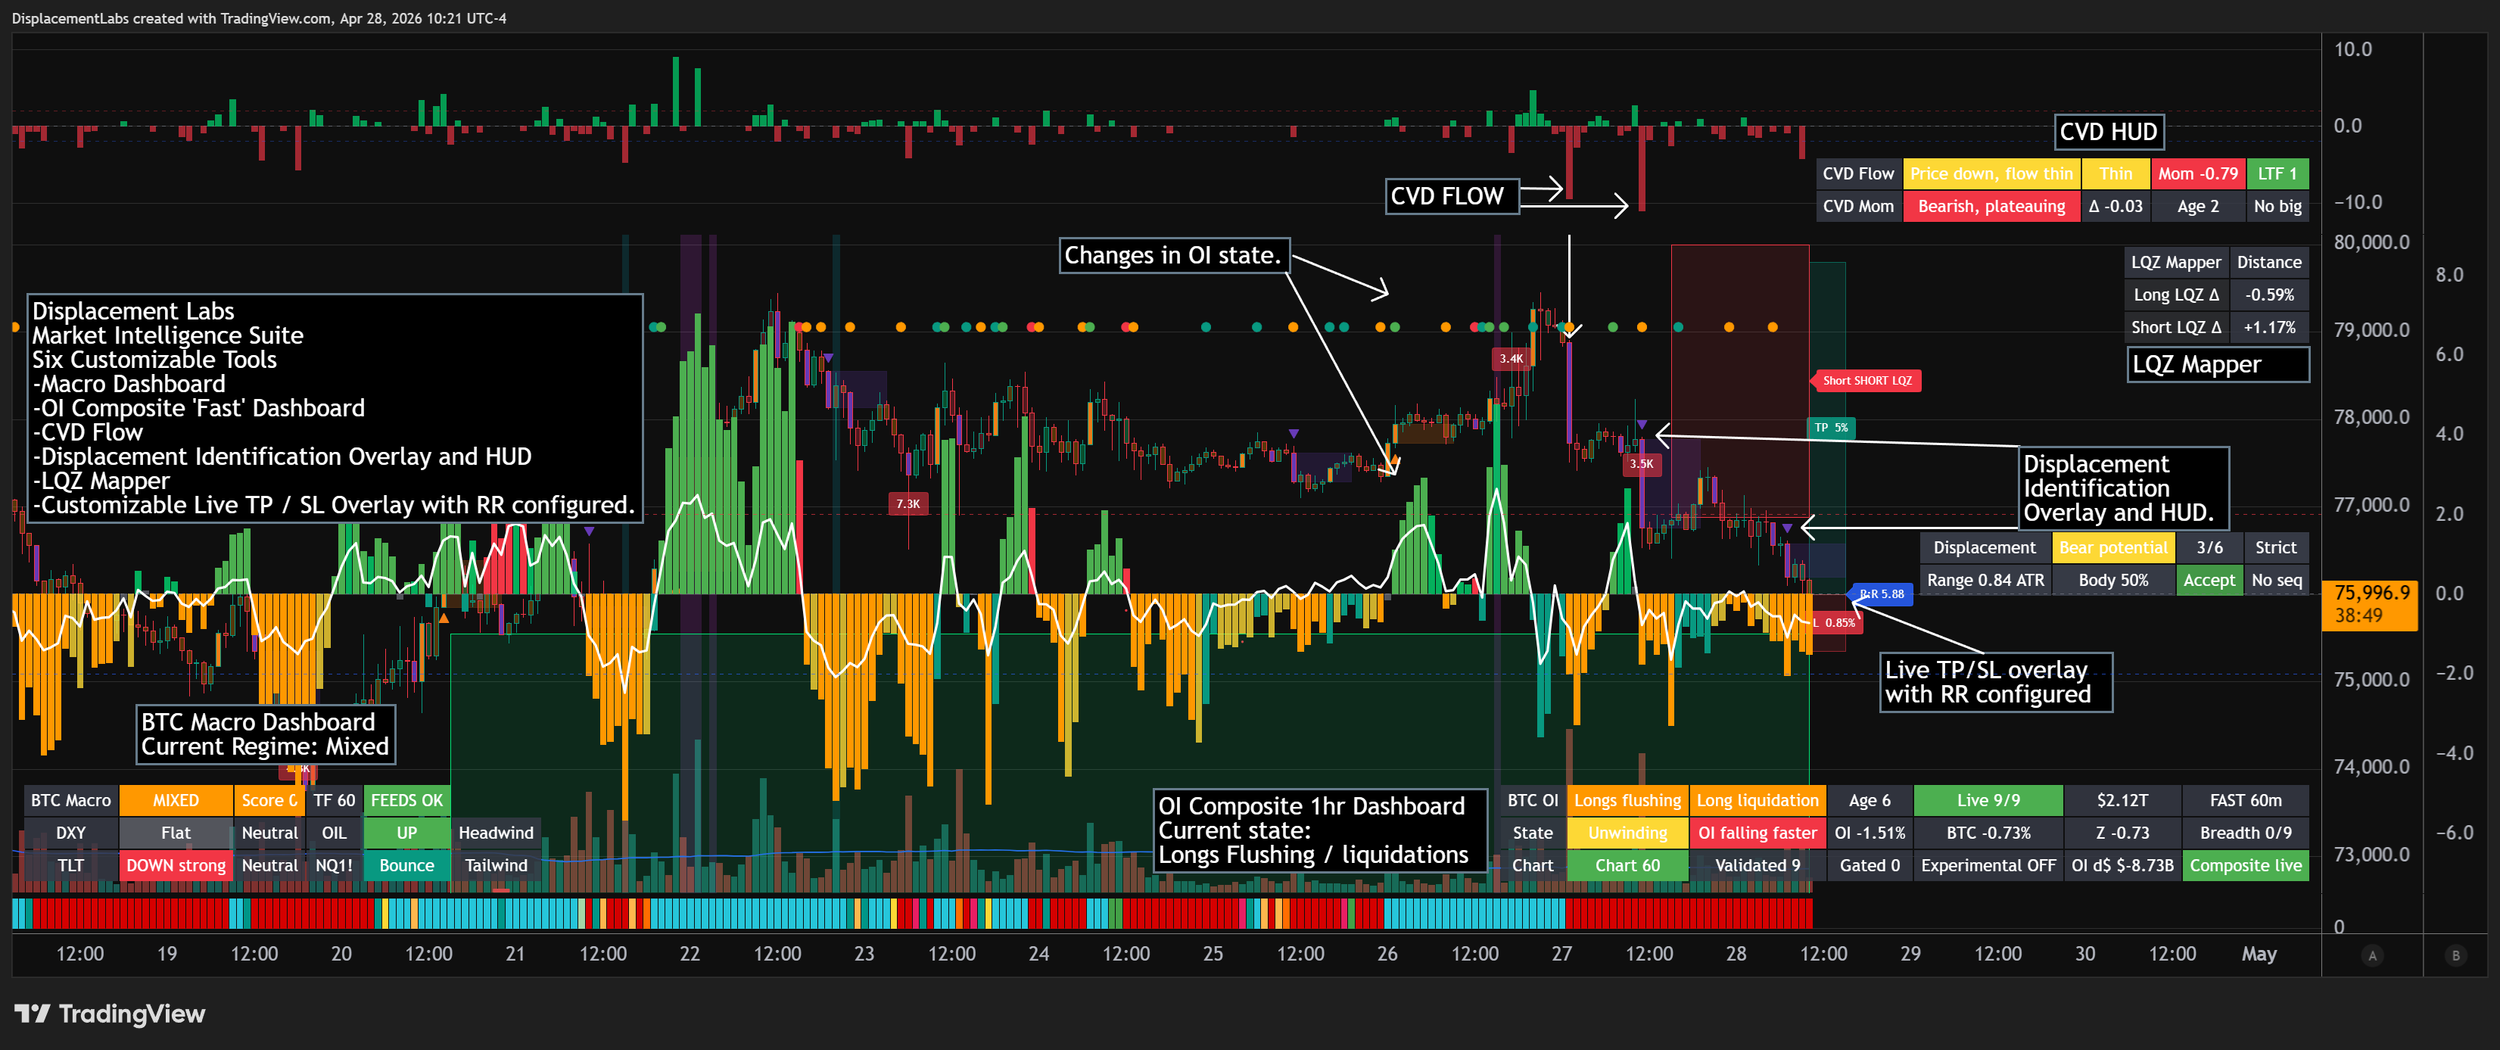
Market Intelligence Suite is designed to turn scattered market data into readable chart context. Each component adds a different layer of information, helping users build a more complete view of digital asset market conditions.
Capability 1: Macro StateIdentify whether broader market conditions are constructive, mixed, defensive, or unstable before evaluating an analysis idea.Capability 2: Open Interest Context
Track whether price movement is being supported by positioning expansion, liquidation pressure, unwinding, or mixed open-interest conditions. Capability 3: CVD / Flow
Compare price movement against buy-side and sell-side pressure so you can see when flow confirms, diverges from, or weakens behind a move.
Capability 4: Displacement IdentificationHighlight larger directional movement and displacement zones where market structure may be shifting with enough force to matter.Capability 5: Liquidation Zone Mapping Map nearby long and short liquidation-zone references so vulnerable areas are visible directly on the chart.Capability 6: TP/SL Visualization
Visualize user-defined target, stop, and risk/reward areas using configurable chart overlays.Market Intelligence Suite is charting and decision-support software only. It does not provide financial advice, investment recommendations, trade signals, copy trading, account management, or guaranteed outcomes.
Customizable Workflow
Built to fit your charting workflow.
Market Intelligence Suite is designed for users who want control over their charting workflow. Where supported, users can adjust visual layers, dashboard visibility, color behavior, thresholds, TP/SL planning inputs, and alert behavior to fit different chart layouts and timeframes.Use dashboards and overlays together or separately. Show only the market layers relevant to your current workflow. Adjust supported settings for visual clarity and chart density. Combine market context with your own analysis process.
How The Suite Is Used
Context before interpretation.
Cleaner chart context starts with clearer structure.
Review Movement Context.
Use Case 1: Read The Environment

Check whether the market is showing clean participation, mixed conditions, weak sponsorship, or liquidation-driven behavior.
Use Case 2: Validate Movement
Compare price movement against flow, OI state, displacement, and market breadth before treating a move as meaningful.Use Case 3: Plan The Chart
Use liquidation-zone references and TP/SL overlays to keep risk areas visible while analyzing structure.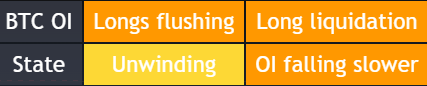
Open Interest Dashboard
CVD / Flow Tools
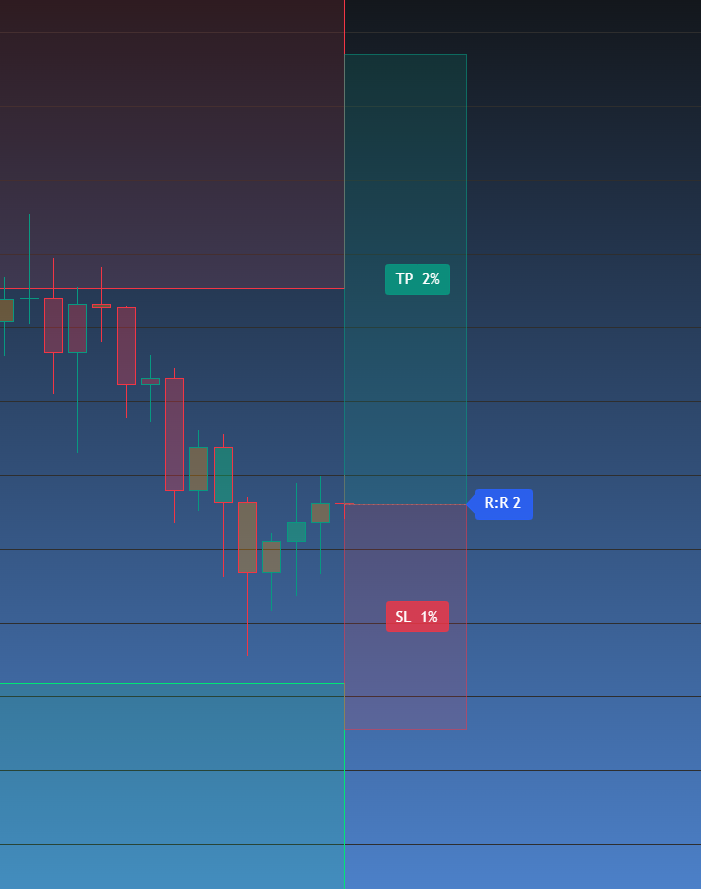
TP/SL Visualization
Subscribe to Market Intelligence Suite
Get recurring access to the Market Intelligence Suite through compatible invite-only charting scripts.
After checkout, access is manually granted using the public charting-platform username provided.
A compatible charting-platform account with sufficient premium features is required to use the tools. Displacement Labs subscriptions provide access to Displacement Labs scripts only and do not include third-party platform subscriptions, data plans, or platform feature access.
Market Intelligence Suite is charting and decision-support software only. It does not provide financial advice, trade recommendations, copy trading, performance promises, or guaranteed outcomes.